Credit card transactions, how we engage with apps and social media, and even our location and habits while we drive are represented in the 2.5 quintillion bytes of data being created every day. This data is used to inform decisions, feed algorithms and artificial intelligence, and generate massive profits in the process.
In an age where data is an asset that runs the risk of being exploited, how do we guarantee ethical standards and practices that not only protect our data but also ensure that it is being used for good? What can we do to ensure data is collected in an equitable and fair way, that is an accurate reflection of our community makeup? There’s no simple answer to these questions, but there is an opportunity to address these concerns head on through technology and innovation.
Solutions that offer an inclusive approach to data collection and interpretation empower local decision makers by providing them with information that is representative of the populations who are or will be affected. When stakeholder data is collected and analyzed in a thoughtful and unbiased way, it can be used to understand a city’s problems, develop solutions, and evaluate whether those fixes are working and equitable.
DATA & DENVER
A recent Smart Cities Dive article highlighted Denver’s new approach to data management that uses a data hub to support agencies that previously operated in silos. The new hub, which is the result of a partnership between Alliance members the City and County of Denver and Slalom LLC, is a “central and searchable repository that allows officials within the city and its county to mix datasets to create advanced analytics and provide faster access to the most current and accurate data available” [from the Smart Cities Dive article].
The datasets that are publicly available through the online Open Data Catalog include things like curb ramps (delineated from aerial imagery), obesity (managed by the Colorado Department of Public Health and Environment), water quality of lakes and streams, and more, for a total of 260 datasets.
What are examples of applications for these kinds of data?
- Curb ramps are a “concrete” example of an accessibility feature that enables Americans with disabilities to travel more easily along urban thoroughfares. A geographic study of curb ramp concentrations could reveal gaps in coverage, thus showing areas that aren’t welcoming to those with limited mobility.
- Areas of high obesity often imply equity concerns. Are these places food deserts that lack healthy and nutritional options for sustenance? How do these limited options impact or relate to other health indicators that help determine quality of life?
- Though the Denver water quality data available to the public pertains to lakes and streams (not specifically to drinking water), this information can serve as an indicator for the health of the surrounding environment. Maintaining clean and healthy water resources protects human health, ecosystems, and even our local economy.
Denver is currently in its first year of using the new data hub. It remains to be seen how this new tool will be used to make decisions and take action. Aggregating this data and making it searchable are the first steps on the path to implementing meaningful and long term change.
RESOURCES FOR DATA-DRIVEN DECISION MAKING THAT IS EQUITABLE
During the Alliance’s Revive! Civic Innovation Challenge that launched last Spring, we sought innovative solutions to address specific problems in the areas of: active transportation, economic data, public spaces, the digital divide, and housing stability. The solutions were meant to bolster recovery from the pandemic and its impacts while furthering resilience and equity. Two of the winning solutions are specific to data, and are currently being used by Colorado municipalities to inform equitable decision making:
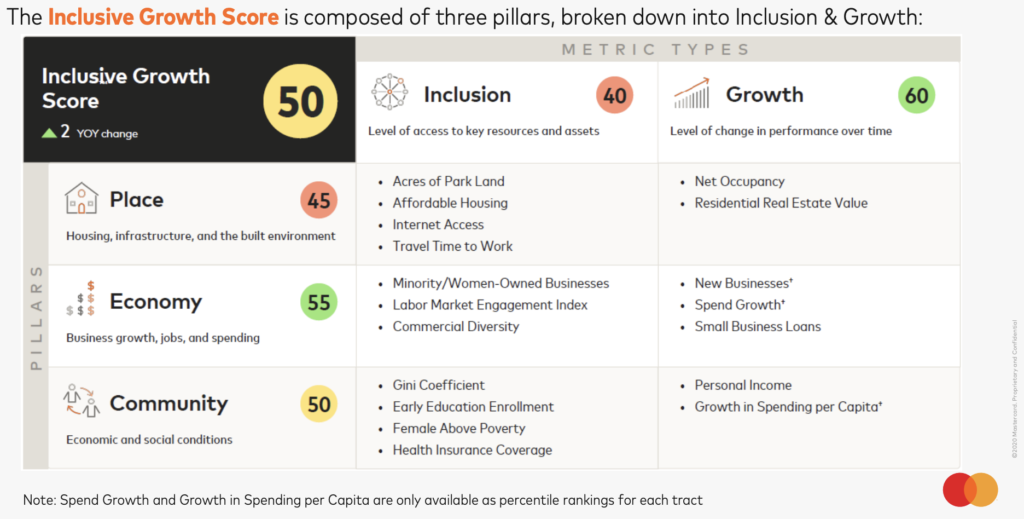
Mastercard – City Possible: Inclusive Growth Score (Alliance Strategic Partner)
The mission of the Mastercard Center for Inclusive Growth is to advance equitable and sustainable economic growth and financial inclusion. The Inclusive Growth Score is a free public-access tool that provides local decision makers with a clear, simple view of social and economic indicators for any census tract in the US.
mySidewalk (Alliance Private Sector Member)
A web-based platform that aggregates, analyzes, and visually displays housing, digital divide, and other datasets for decision-making and impact tracking. Its ready-to-use data enables decision makers to skip data-wrangling, allowing them to jump straight into unlocking insights through visualization and mapping with the desired outcome of affecting change and measuring it.
Both of these platforms can be leveraged to take actions like securing investments in underserved communities, building local data assets for regional development, and bolstering grant applications for communities in need, among other potential uses. The outcomes from the collaborations that were initiated during the Revive! Challenge are still in the works, so stay tuned for future content specific to Colorado communities’ use of these tools.
WHAT DOES THIS MEAN FOR SMART CITIES?
As Alliance Executive Director Tyler Svitak puts it, “The challenges facing cities today are complex. They cross boundaries that require alignment and collaboration to solve, and they present themselves differently from city to city…”. Data is a powerful and essential tool to tackling these challenges and bringing balance to inequity. Current technology enables us to collect and analyze data in greater quantities and at a faster rate than ever before, but we still play an important role in what data is collected, who is represented, and how it is used to make equity decisions. Smart cities should have data to inform decisions and measure their impact, they should have the tools to use the data effectively, and they should have governance that establishes structure for proper management and use of the data shaping our communities.